by Bzowski et al.
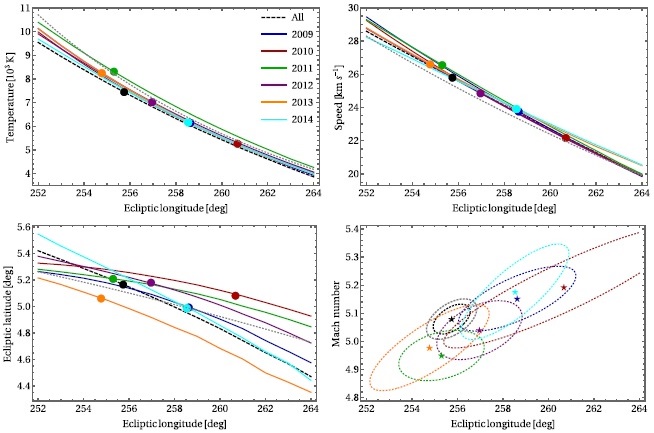
Abstract: We analyzed observations of interstellar neutral helium (ISN He) obtained from the Interstellar Boundary Explorer (IBEX) satellite during its first six years of operation. We used a refined version of the ISN He simulation model, presented in the companion paper by Sok´oł et al. (2015a), and a sophisticated data correlation and uncertainty system and parameter fitting method, described in the companion paper by Swaczyna et al. (2015). We analyzed the entire data set together and the yearly subsets, and found the temperature and velocity vector of ISN He in front of the heliosphere. As seen in the previous studies, the allowable parameters are highly correlated and form a four-dimensional tube in the parameter space. The inflow longitudes obtained from the yearly data subsets show a spread of ~6°, with the other parameters varying accordingly along the parameter tube, and the minimum X2 value is larger than expected. We found, however, that the Mach number of the ISN He flow shows very little scatter and is thus very tightly constrained. It is in excellent agreement with the original analysis of ISN He observations from IBEX and recent reanalyses of observations from Ulysses. We identify a possible inaccuracy in the Warm Breeze parameters as the likely cause of the scatter in the ISN He parameters obtained from the yearly subsets, and we suppose that another component may exist in the signal, or a process that is not accounted for in the current physical model of ISN He in front of the heliosphere. From our analysis, the inflow velocity vector, temperature, and Mach number of the flow are equal to λISNHe = 255.8° ± 0.5°, βISNHe = 5.16° ± 0.10°, TISNHe = 7440 ±260 K, vISNHe = 25.8 ± 0.4 km s-1, and MISNHe = 5.079 ± 0.028, with uncertainties strongly correlated along the parameter tube.
Covariance matrices of inflow parameters (ecliptic longitude, ecliptic latitude, temperature, and speed) for seasons 2009-2014), obtained by fitting the parameters to each yearly data set as well as to the global data set.
